Calibration Errors and Trading Opportunities in Kalshi Political Speech Mention Markets
Luiz Felipe Barbosa · 27 Mar 2026 · 10 min read
Political speech mention markets are a strange corner of the prediction-market world. They do not ask who will win an election or what the Fed will do. They ask whether a live speaker will say a specific word or phrase. That sounds simple until you remember what political events are actually like. A rally can jump from trade policy to grievance to crowd-work in a few minutes. A press briefing can stay on-script for twenty minutes and then get hijacked by one reporter's question.
That unpredictability is exactly what makes these contracts useful for calibration analysis. If market prices really are probabilities, then a contract trading at 20 cents should resolve YES about one-fifth of the time, and a contract at 80 cents should resolve YES about four-fifths of the time.1 When that relationship breaks, the issue is not just whether traders are wrong. It is where they are wrong, how persistent the error is, and whether the error is large enough to survive fees.
This article looks at 7,320 resolved Kalshi political speech mention contracts across 32 series, covering Trump rallies, White House press briefings, NYC mayoral events, and a long tail of one-off political appearances. The main result is straightforward. These markets do learn. Calibration improves over time and tightens as the event approaches. But the market still systematically overprices low-probability YES outcomes, which leaves the NO side materially more attractive than the YES side even after Kalshi's taker fees.
The Dataset
The political subset comes from the broader mention-market dataset used in my cross-category study, but here the focus is narrower: the 7,320 contracts classified as political speech mentions. That makes politics the single largest mention-market category on the platform, accounting for roughly 39% of the full sample.
In raw form, the political sample includes 4.7 million trade positions paired with contract-level metadata such as ticker, title, result, close time, and volume. All VWAP snapshots are anchored to last_trade_time rather than close_time. That distinction matters because Kalshi often settles a contract long after the final trade. If you anchor short-horizon VWAPs to settlement instead of the last trade, you end up measuring stale prices and calling them late information.
The 32 political series fall into four practical subgroups:
- Trade records: timestamps, prices in cents, volumes, and taker-side identification across political mention series.
- Market metadata: ticker, title, resolution, volume, and settlement timestamps for each contract.
Trump markets alone account for nearly half the political sample. Combined with the Niche / One-offs bucket, unscripted or semi-scripted events make up well over three-quarters of the dataset. That composition matters because it means the category is dominated by exactly the kind of events where content can lurch suddenly and where traders are most tempted to chase salient longshots.
| Subgroup | Contracts | Description |
|---|---|---|
| Trump Markets | 3,401 | KXTRUMPMENTION contracts tied to Trump rallies, press conferences, and other public appearances. |
| Press Briefings | 1,032 | KXSECPRESSMENTION contracts from recurring White House press briefings. |
| Mamdani / NYC Mayoral | 724 | KXMAMDANIMENTION and KXNYCMAYORDEBATEMENTION contracts tied to the NYC mayoral race. |
| Niche / One-offs | 2,163 | The remaining political series: Biden, Vance, Sanders, AOC, Hegseth, Hochul, DeSantis, hearings, and other smaller events. |
Methodology
The analysis follows four steps. First, I compute volume-weighted average prices at six horizons before the last trade: 1 day, 6 hours, 2 hours, 1 hour, 30 minutes, and 10 minutes. The 2-hour VWAP is the main snapshot because it is close enough to capture late information without letting a few final prints dominate the signal.
The VWAP at horizon h is:
Calibration then compares implied probability to realized frequency. Contracts are grouped into probability buckets at 1-cent, 5-cent, and 10-cent granularity, and the actual YES rate inside each bucket is compared to the bucket midpoint. A perfectly calibrated market sits on the 45-degree diagonal.2
To summarize that error in one number, I use Mean Absolute Deviation:
Finally, I backtest simple threshold strategies on the 2-hour VWAP using Kalshi's taker fee schedule:
- Buy YES when the 2-hour VWAP is above a chosen threshold.
- Buy NO when the 2-hour VWAP is below a chosen threshold.
- Test thresholds at 10-point intervals from 10% through 90%, then evaluate average net PnL per trade after fees.
A Market That Is Learning
Before looking at static calibration curves, it helps to ask whether the category itself has improved over time. Using all 4.7 million trade positions, I compute cumulative mean absolute deviation at weekly intervals.
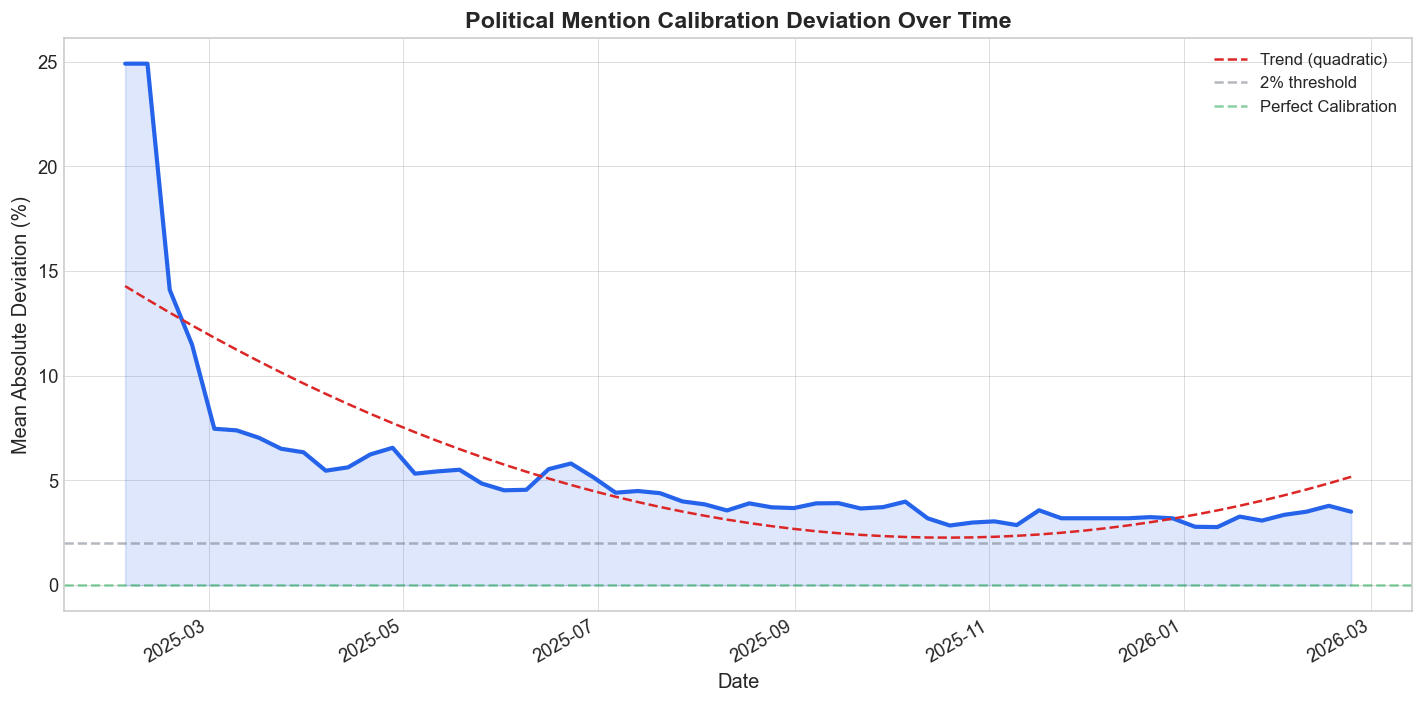
The direction is unambiguous. Early political mention markets were much sloppier than recent ones. The overall MAD is 5.35 percentage points, but that average hides a sharp improvement from 12.97% in the first eight weeks to 3.26% in the last eight weeks, with a trend of about -0.166 percentage points per week.
That is what market learning looks like.3 Traders accumulate experience with the contract format, liquidity improves, and repeated event types give participants some historical memory. But learning is not the same thing as full efficiency. A recent-period MAD above 3% is still too large to dismiss as harmless noise, especially in a market whose prices are supposed to read like straight probabilities.
Overall Calibration
The aggregate 2-hour calibration curve shows the classic longshot bias. Low-probability YES contracts resolve YES less often than their price implies, while higher-probability YES contracts resolve YES more often than the market gives them credit for.
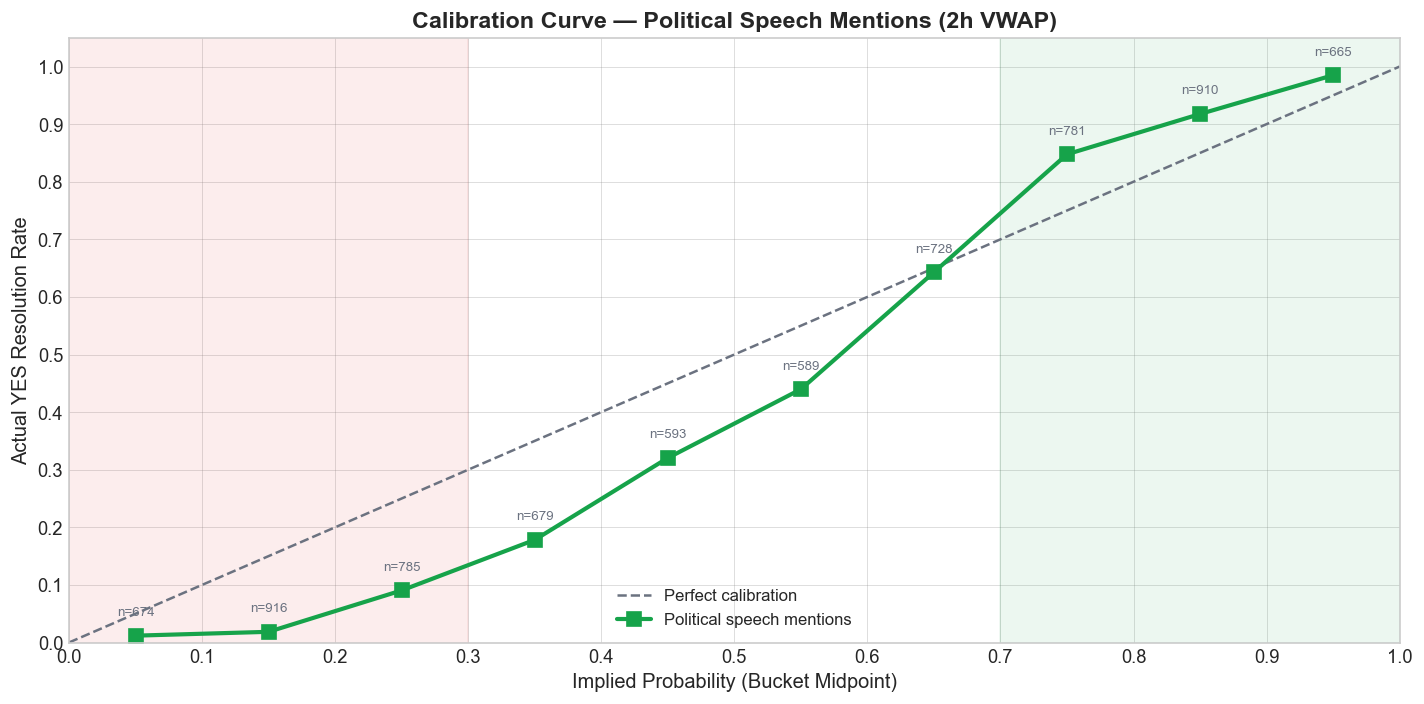
In other words, traders overpay for the chance that a politically salient word might pop up even when the base rate says it usually will not. That is the longshot side of the distortion. At the upper end, the market is too hesitant to price obvious mentions aggressively enough.
This pattern is familiar from the broader betting and prediction-market literature, and it has also been documented at the Kalshi-wide level.4 Political speech markets are a particularly clean setting for it. The contracts are short-lived, the wording is crisp, and the event windows are easy to verify. When the same S-shaped calibration curve keeps appearing here, it is hard to call it an accident.
Directional Accuracy by Subgroup
A simpler test is directional accuracy: if the 2-hour VWAP is above 50 cents, predict YES; otherwise predict NO. By that standard, every subgroup is comfortably above a coin flip.
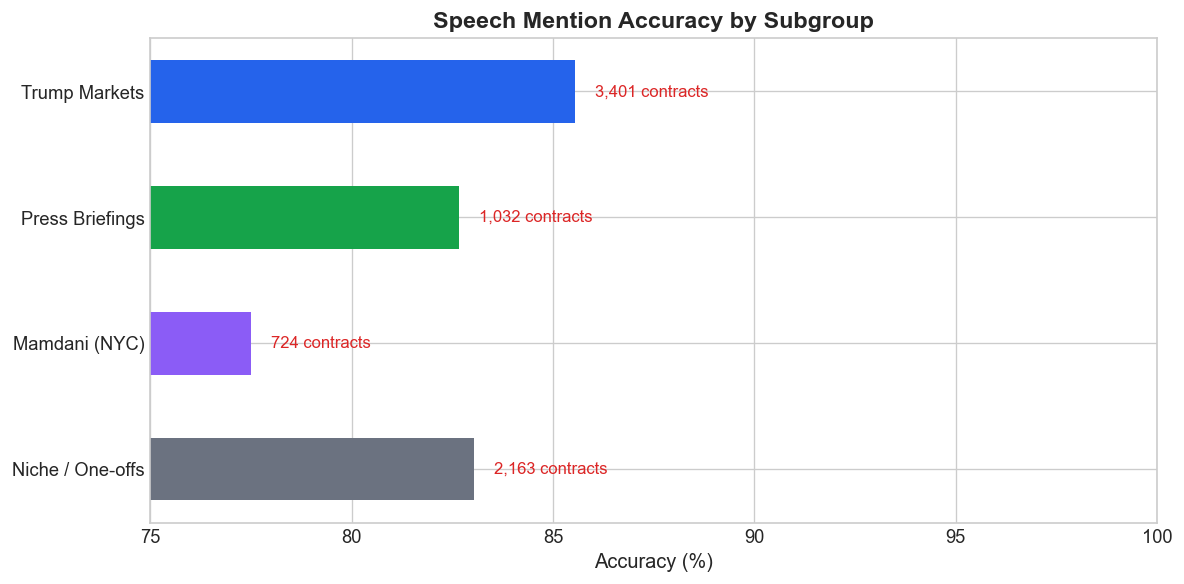
That matters because it tells us these are not nonsense markets. They contain real signal. The problem is precision, not direction. The crowd usually knows which side is more likely to win; it just does a noticeably worse job of pricing how likely that side actually is.
Trump Markets
Trump mention markets are the largest and most liquid subgroup, with 3,401 contracts. If liquidity alone solved calibration, this should be the cleanest part of the category. It is not.
Trump rallies and public appearances create a peculiar mix of depth and chaos. The order flow is heavy, but the underlying event remains structurally unstable. A speaker who improvises constantly is hard to price precisely, even when plenty of people are trading him.
1-cent buckets
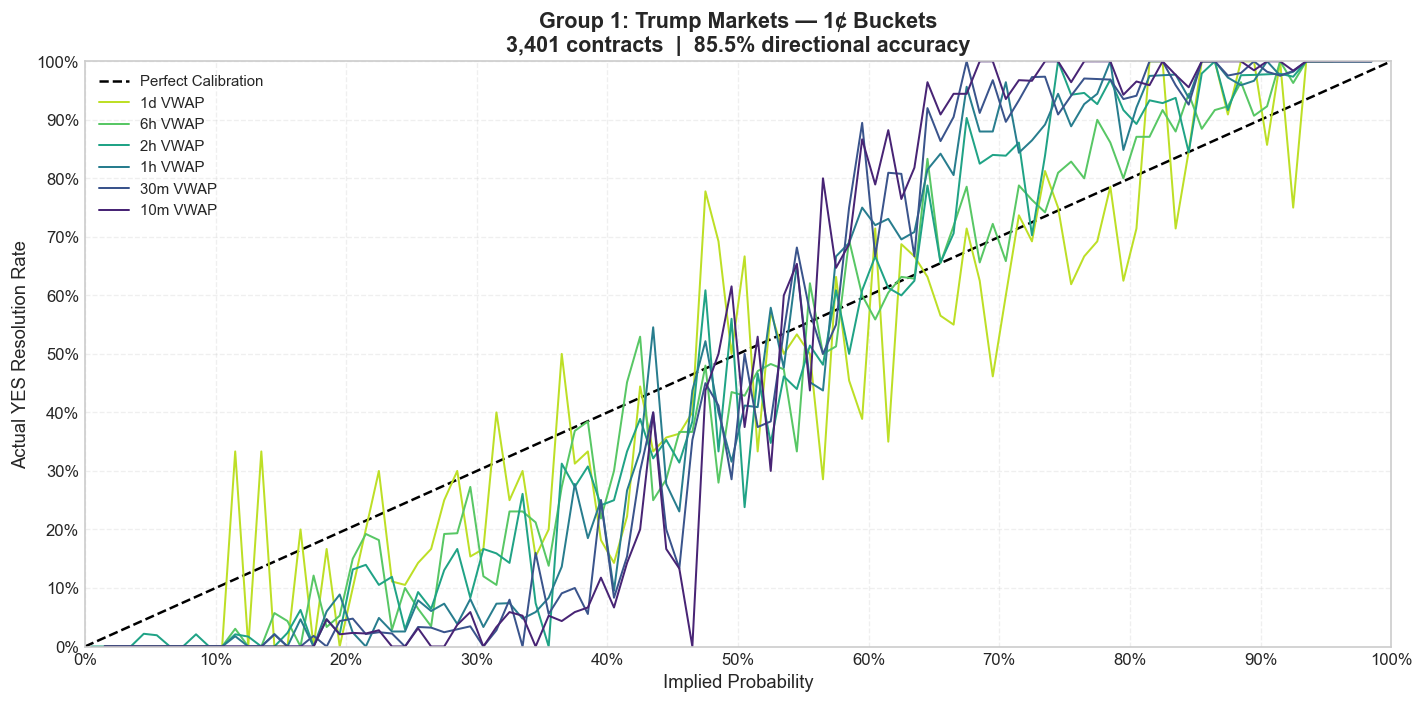
Across all three bucket sizes, the same shape survives smoothing. The 10% to 30% range is too optimistic on YES, while the higher-probability range understates how often obvious mentions actually land. The deeper market helps, but it does not erase the bias.
Press Briefings
White House press briefings are more regular than rallies. They have a predictable structure, a recurring cast of reporters, and a narrower vocabulary of likely topics. In theory, that should produce tighter calibration than a Trump rally.
It does, but only up to a point. Regularity helps, yet these briefings are still reactive political events. One breaking-news question can reroute the whole session and make the calm-looking prior probabilities feel flimsy in hindsight.
1-cent buckets
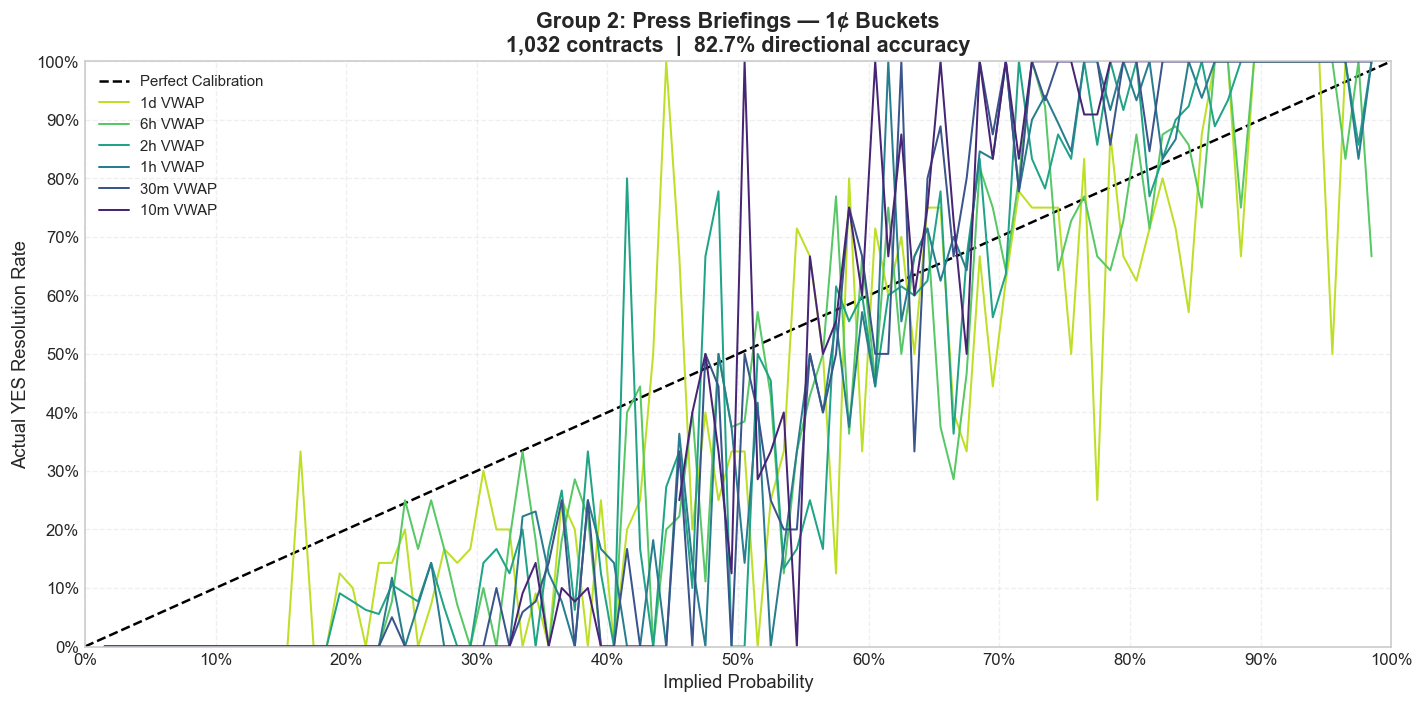
The briefing curves hug the diagonal more closely than Trump markets at fine granularity, but the longshot bias remains visible once the noise is smoothed out. Routine format is not the same thing as full predictability.
Mamdani and NYC Mayoral Markets
The Mamdani and NYC mayoral subgroup is smaller, thinner, and more local. That usually means two things at once: less efficient pricing and less scalable opportunity.
This is where the informational asymmetry story becomes more plausible. Local political context is not distributed evenly across the trader base. A niche participant who actually follows the race is operating in a much richer information environment than the average tourist clicking around a mention market.
1-cent buckets
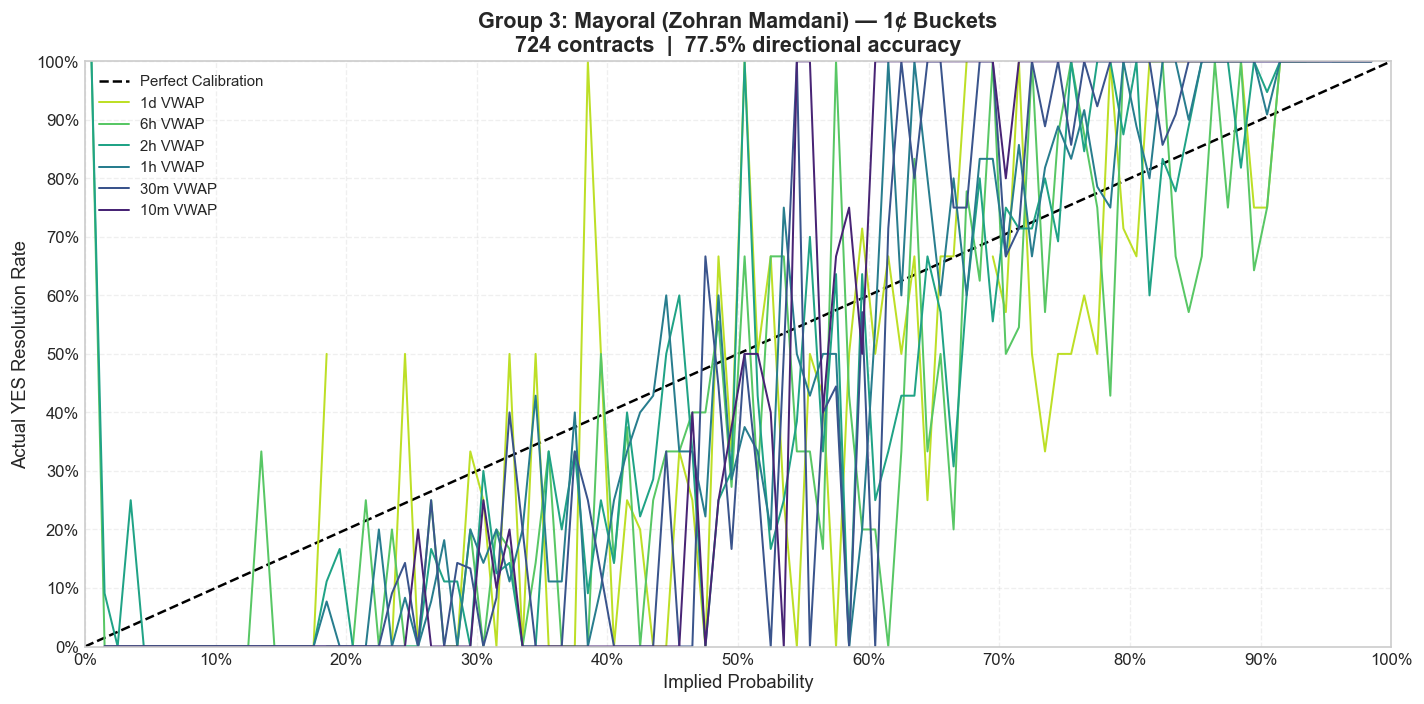
The curves are noisier because the sample is smaller, but the pattern is not random. Once the bucket size is widened, the same longshot distortion reappears, and in some price bands the mispricing looks even larger than in the national political series.
Niche and One-Off Events
The catch-all political bucket includes hearings, agency events, smaller speeches, and all the series that do not repeat often enough to build a neat subgroup identity. Individually, many of these markets are too thin to say much about. Collectively, they answer a better question: does the bias survive outside the headline series?
It does.
1-cent buckets
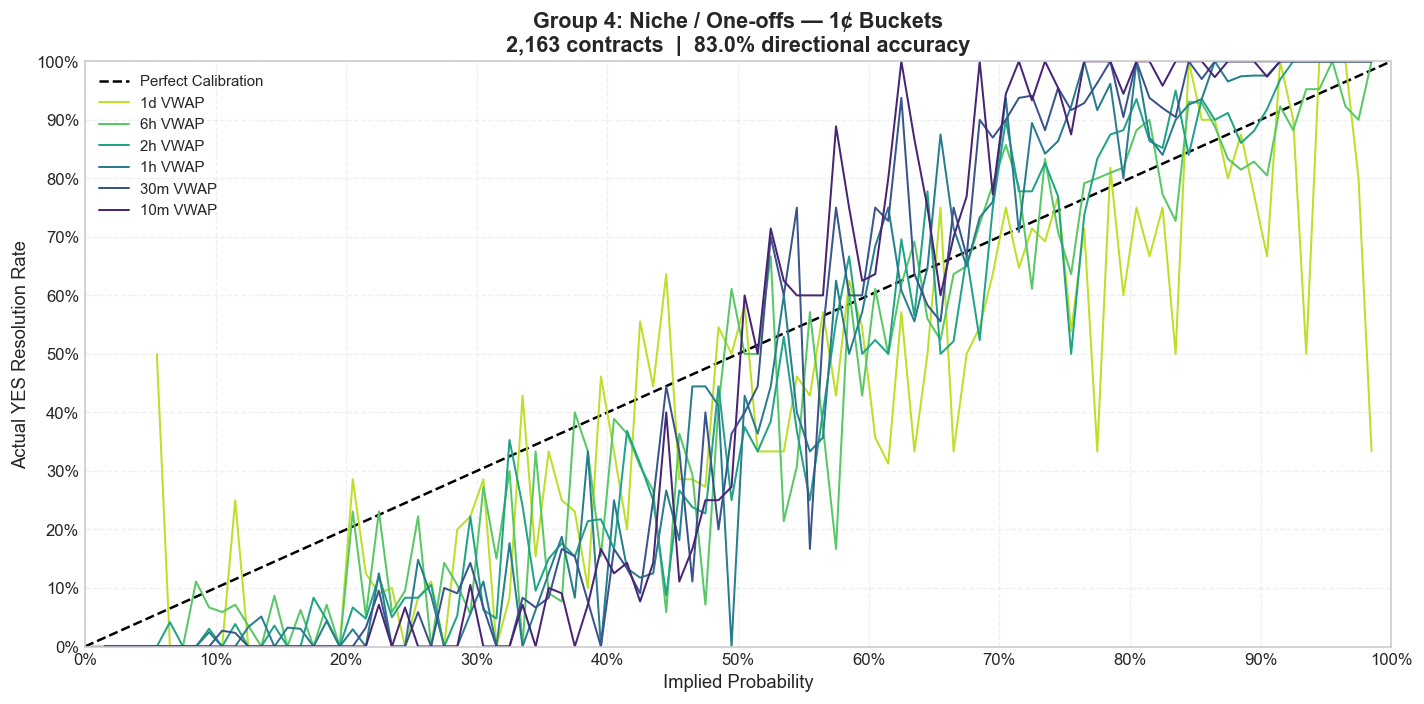
Once the one-offs are pooled, the same structural pattern returns. That matters because it suggests the bias is not unique to Trump rallies or White House briefings. It appears to be a broader feature of how traders price political mention uncertainty.
VWAP Price Trajectories
The calibration plots summarize the error. The VWAP traces show how that error develops over the life of the contract. Each line below is one contract tracked from one day out to ten minutes before the last trade. Green lines resolve YES; red lines resolve NO.
Trump Markets
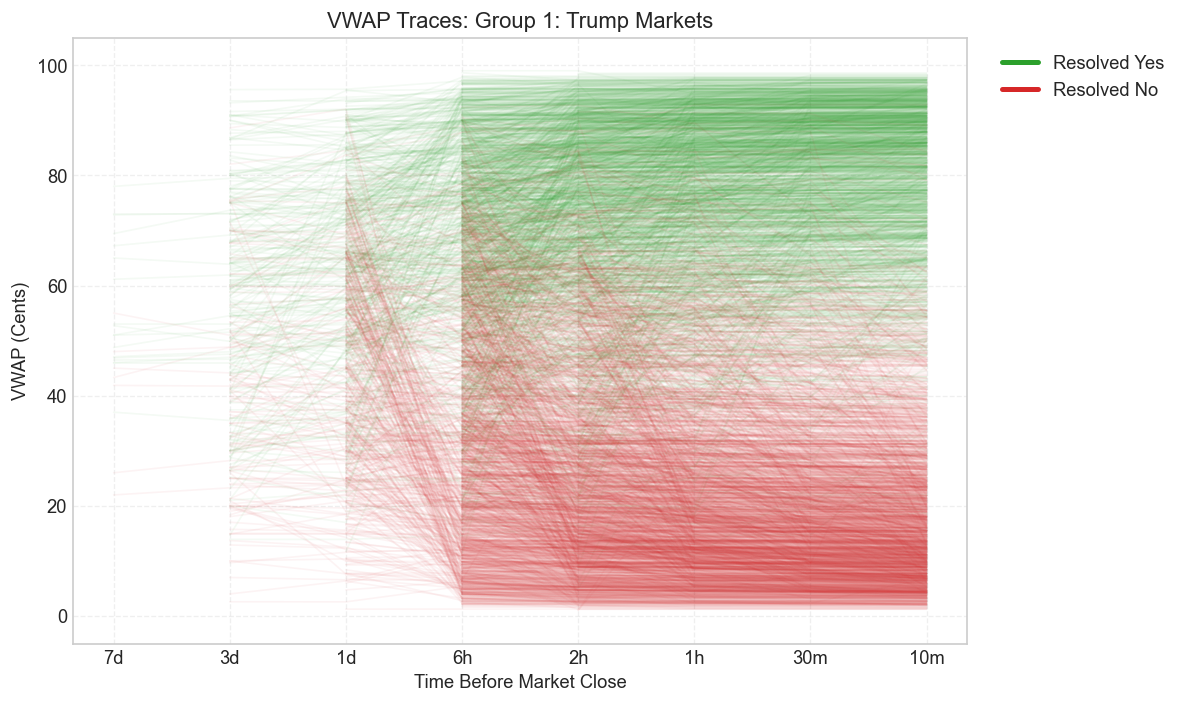
The main visual fact is separation. As the event approaches, the green and red paths pull apart and prices funnel toward 0 or 100. But the degree of separation differs by subgroup. Trump and press briefings gain clarity at different speeds. Mamdani stays noisier longer. The one-offs remain the messiest.
Temporal Convergence
That timing difference shows up more clearly once the curves are collapsed into MAD. Every subgroup improves as the event gets closer. None of them improve at the same speed.
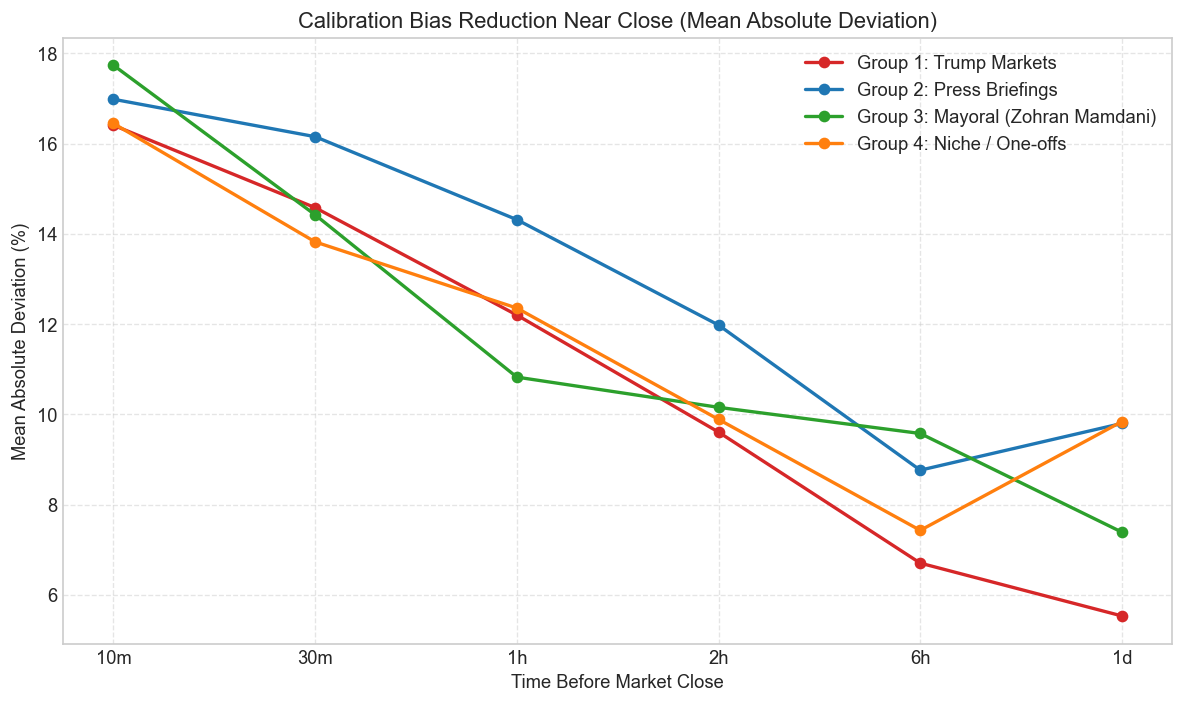
Press briefings start cleaner. Trump contracts improve sharply late. Mamdani is the most volatile. The one-offs sit in the middle. The broad point is that convergence is real, but convergence speed depends on the information structure of the underlying event, not just on the clock.
Strategy Profitability
The practical question is whether any of this survives the fee schedule. The answer is yes, but asymmetrically.
Buy YES only becomes meaningfully attractive once the market is already pricing the contract as fairly likely. Buy NO, by contrast, is profitable across every tested threshold and is strongest in the 40% to 50% range, where the market still pays too much for mention risk.
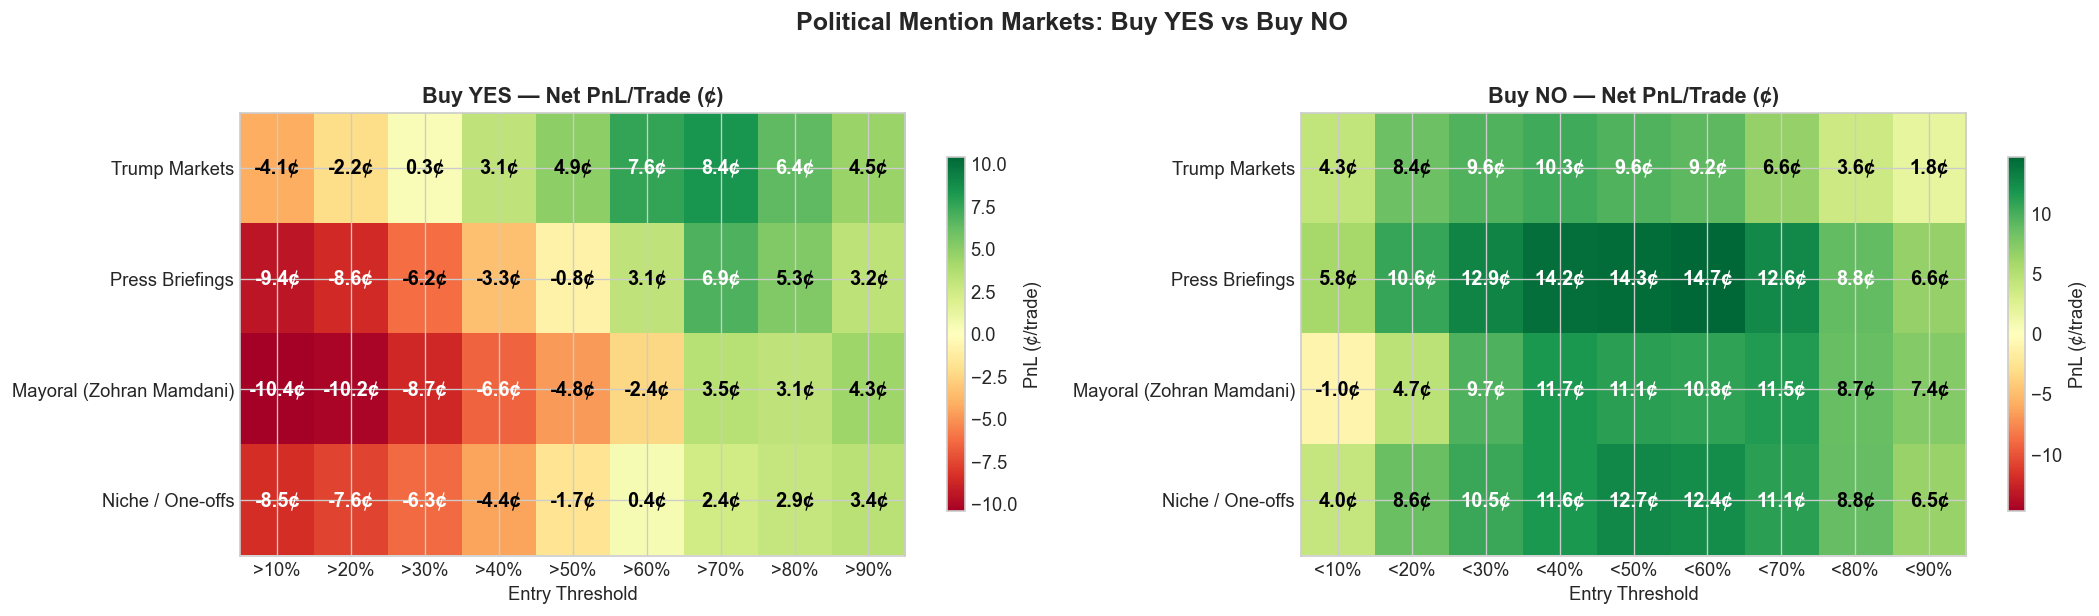
The best YES threshold in the political sample is above 70%, where the strategy earns 5.3 cents per trade across 2,356 trades with a 91% hit rate. The best NO threshold is below 40%, where the strategy earns 12.0 cents per trade across 3,050 trades with a 93% hit rate.
That is the core asymmetry of the category. Traders pay up for the possibility that a word might come up. The market is much less eager to price the far more common outcome: that it will not.
| Side | Threshold | Trades | Avg PnL / Trade | Hit Rate |
|---|---|---|---|---|
| YES | >60% | 3,084 | +2.2 cents | 83% |
| YES | >70% | 2,356 | +5.3 cents | 91% |
| YES | >80% | 1,575 | +4.4 cents | 94% |
| NO | <30% | 2,370 | +10.7 cents | 96% |
| NO | <40% | 3,050 | +12.0 cents | 93% |
| NO | <50% | 3,644 | +11.9 cents | 88% |
Trump Strategy Deep Dive
Because Trump markets dominate the sample, they deserve a closer look. They are the best test of whether the edge is a small-sample illusion or a market with real scale.
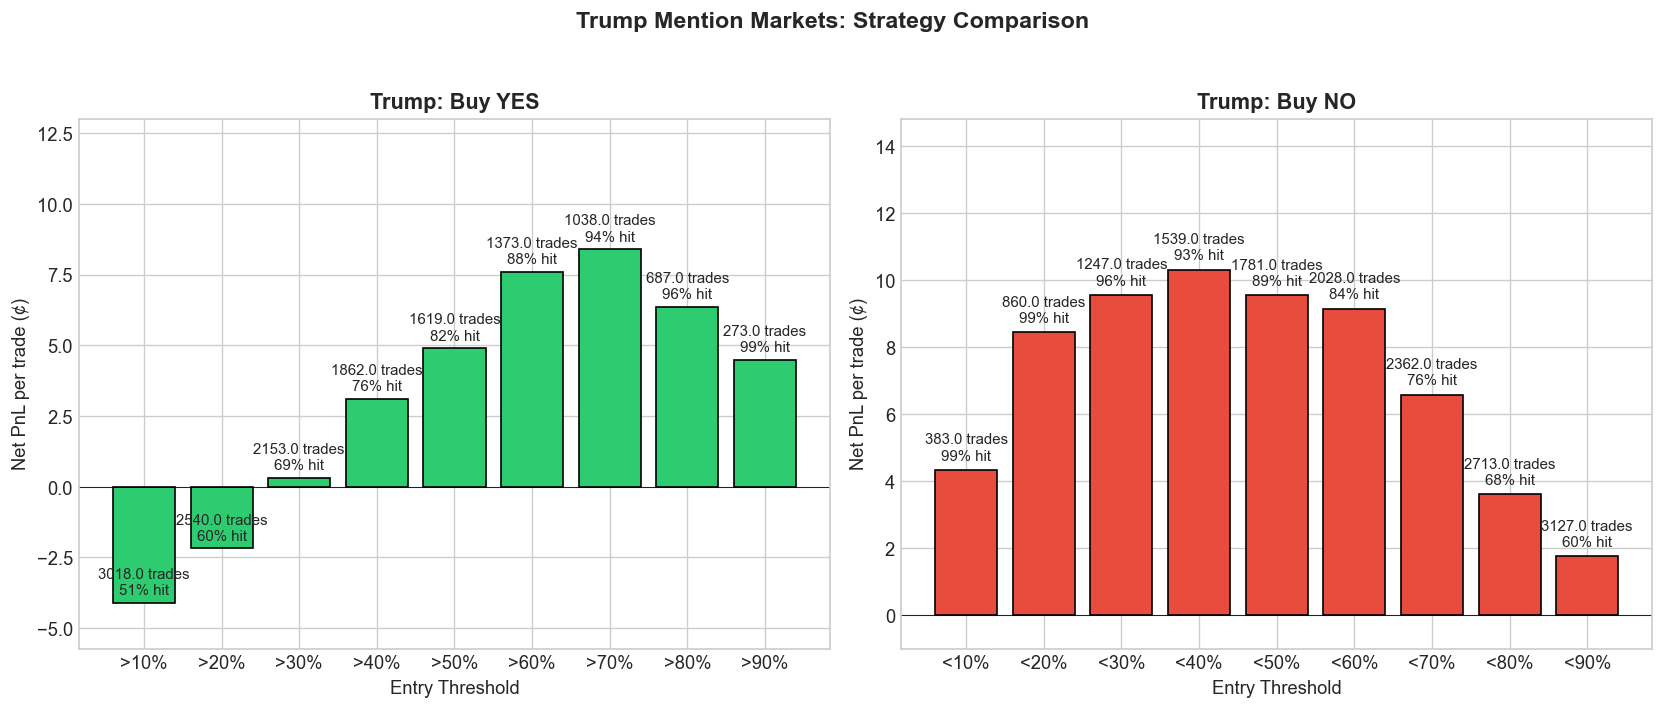
The Trump-only backtest looks like a more concentrated version of the category-wide result. NO-side trades remain consistently strong, and YES-side trades turn positive only once the contract is already heavily leaning that way. With 3,401 contracts, this is the least plausible place to dismiss the edge as an accident.
Why These Markets Stay Miscalibrated
Why does the bias survive? Part of the answer is that political speech is genuinely hard to model. The relevant uncertainty is not just what the speaker believes or what the staff prepared. It is what will actually be said under live pressure, in sequence, with interruptions, digressions, and crowd feedback.
Another part is behavioral. Salient words attract attention. A trader who is watching politics as spectacle is more likely to overpay for a vivid mention scenario than for the much duller base-rate outcome that nothing unusual gets said. That is exactly the sort of setting where longshot bias should thrive.5
Information asymmetry and execution matter too. Some traders know the local context better than others. And late liquidity is often too thin to fully arbitrate the remaining mistakes away, especially in smaller subgroups.6 The result is a market that learns, but does not quite finish the job.
The Fee Curve Helps the NO Side
Kalshi's taker fee schedule is concave: it is highest around 50 cents and cheaper near the extremes.7 That is an important detail because the largest political mention errors cluster near the low and high ends of the price distribution, not in the middle.
A trader buying NO below 30 or 40 cents is paying relatively little in fees at exactly the place where the market most often overstates YES probability. The exchange does not create the edge, but it does make the edge easier to keep.
A maker strategy would strengthen that result further. Resting limit orders avoid taker fees altogether, although the tradeoff is obvious: better economics, worse fill certainty.8
Limitations
This is still an in-sample analysis. The same data used to estimate miscalibration is also used to evaluate the strategies, and the calibration-over-time chart makes clear that the size of the edge has already narrowed as the market matured.
The raw contract count also overstates the amount of independent information in the sample. A single speech can spawn twenty related mention contracts that move together and often resolve together, so true drawdown risk is lumpier than the contract count makes it look.
Finally, the backtest assumes execution at the 2-hour VWAP. That is a useful standardized snapshot, but it is not a fill model. Queue position, slippage, and order-book depth all matter in live trading, especially if size is scaled.
Conclusion
Kalshi's political speech mention markets are better than random and worse than they look. They contain real predictive signal, they have become more calibrated over time, and they do tighten as the event approaches. But they still systematically overprice low-probability YES outcomes.
That leaves the economically interesting result. The best edge in this category is usually not buying the dramatic mention. It is taking the other side and getting paid to say that the speaker probably will not mention it.
For traders, that means the NO side remains the cleaner structural trade. For researchers, these contracts are a useful laboratory for studying how crowds price events that are partly informational and partly theatrical. And for market designers, the persistence of the bias is a reminder that cleaner contract wording does not automatically produce cleaner probabilities.
Works Cited
- Arrow, K. J., Forsythe, R., Gorham, M., Hahn, R., Hanson, R., et al. "The Promise of Prediction Markets." Science, 320(5878), 2008. https://doi.org/10.1126/science.1157679
- Brown, A., Reade, J. J., and Vaughan Williams, L. "When Are Prediction Market Prices Most Informative?" International Journal of Forecasting, 35(1), 2019. https://doi.org/10.1016/j.ijforecast.2018.07.012
- Bürgi, C., Deng, W., and Whelan, K. "Makers and Takers: The Economics of the Kalshi Prediction Market." CESifo Working Paper No. 12122, 2025. https://ssrn.com/abstract=5502658
- Kahneman, D. and Tversky, A. "Prospect Theory: An Analysis of Decision under Risk." Econometrica, 47(2), 1979. https://doi.org/10.2307/1914185
- Kalshi. "Fee Schedule." https://kalshi.com/docs/kalshi-fee-schedule.pdf
- Kalshi Help Center. "How is Kalshi regulated?" https://help.kalshi.com/en/articles/13823765-how-is-kalshi-regulated
- Kalshi Help Center. "Limit Orders." https://help.kalshi.com/en/articles/13823811-limit-orders
- Page, L. and Clemen, R. T. "Do Prediction Markets Produce Well-Calibrated Probability Forecasts?" The Economic Journal, 123(568), 2013. https://doi.org/10.1111/j.1468-0297.2012.02561.x
- Snowberg, E. and Wolfers, J. "Explaining the Favorite-Long Shot Bias: Is It Risk-Love or Misperceptions?" Journal of Political Economy, 118(4), 2010. https://doi.org/10.1086/655844
- Tetlock, P. C. "Liquidity and Prediction Market Efficiency." SSRN, 2008. https://ssrn.com/abstract=929916
- Wolfers, J. and Zitzewitz, E. "Prediction Markets." Journal of Economic Perspectives, 18(2), 2004. https://doi.org/10.1257/0895330041371321
More Articles
Cross-Category Calibration Analysis of Kalshi Mention Markets
15 Mar 2026A cross-category study of 18,948 Kalshi mention contracts showing that calibration improves as events approach, but longshot bias still leaves the NO side systematically underpriced.
How Zohran Mamdani Won New York City
14 Dec 2025By rejecting the conventional political consensus and proposing “Material Populism” that addressed voters’ immediate economic struggles, Mamdani defeated the “Business Party” establishment to win the NYC mayoral election.
An Analysis of PressTV and Three Privately-Owned Israeli News Channels on Telegram
12 May 2026A comparative NLP analysis of PressTV and three privately owned Israeli Telegram news channels, showing how ownership shapes cadence, topic structure, and media strategy while all four converge around a fear-dominant Iran-Israel-US frame.